ISPM Dashboard
Designing Saviynt's First Enterprise Dashboard at Scale
Saviynt
2024-2025
UX Design Lead
Live with 12 enterprise customers, Saviynt's first multi-tenant product
Saviynt is a cloud-native Identity Governance and Administration (IGA) platform that helps organizations secure their digital identities, applications, and data across cloud, hybrid, and on-premises environments. It is designed to manage user access, automate compliance, and mitigate risks by providing a unified view of all human and machine identities.
The Challenge
ISPM was Saviynt's first multi-tenant product and its first true dashboard experience, which were both firsts with no internal precedent to draw from. The business demanded a monthly release cadence, three times faster than the platform's usual schedule, compressing design windows to days at a time. I was the sole designer responsible for the entire product surface, from foundational architecture to individual widget interactions, while simultaneously building the component library needed to support it.
Navigating Constraints
Tech stack pivot, mid-flight. Engineering initially committed to Apache Superset as the dashboard engine. When it proved too rigid to accommodate Saviynt's design system and customer workflows, I led the UX transition to an in-house solution, reframing the pivot as an opportunity to design the experience on our own terms rather than around someone else's constraints.
Designing for enterprise data scale. Customers like GE Healthcare were tracking identities and resources in the millions. Standard trend visualizations became unreadable at that scale. I introduced range-bound notation and rescaled visualizations against specific timeframe windows rather than total resource pools. It was a deliberate information design decision that made data meaningfully actionable.
Building the foundation while shipping the product. The component library had to be built in parallel with active feature delivery. I collaborated with the design system owner to establish dashboard-specific patterns for widget interactions, data notations, and status color semantics. This ensured every release extended the system rather than fragmenting it.
The Solution
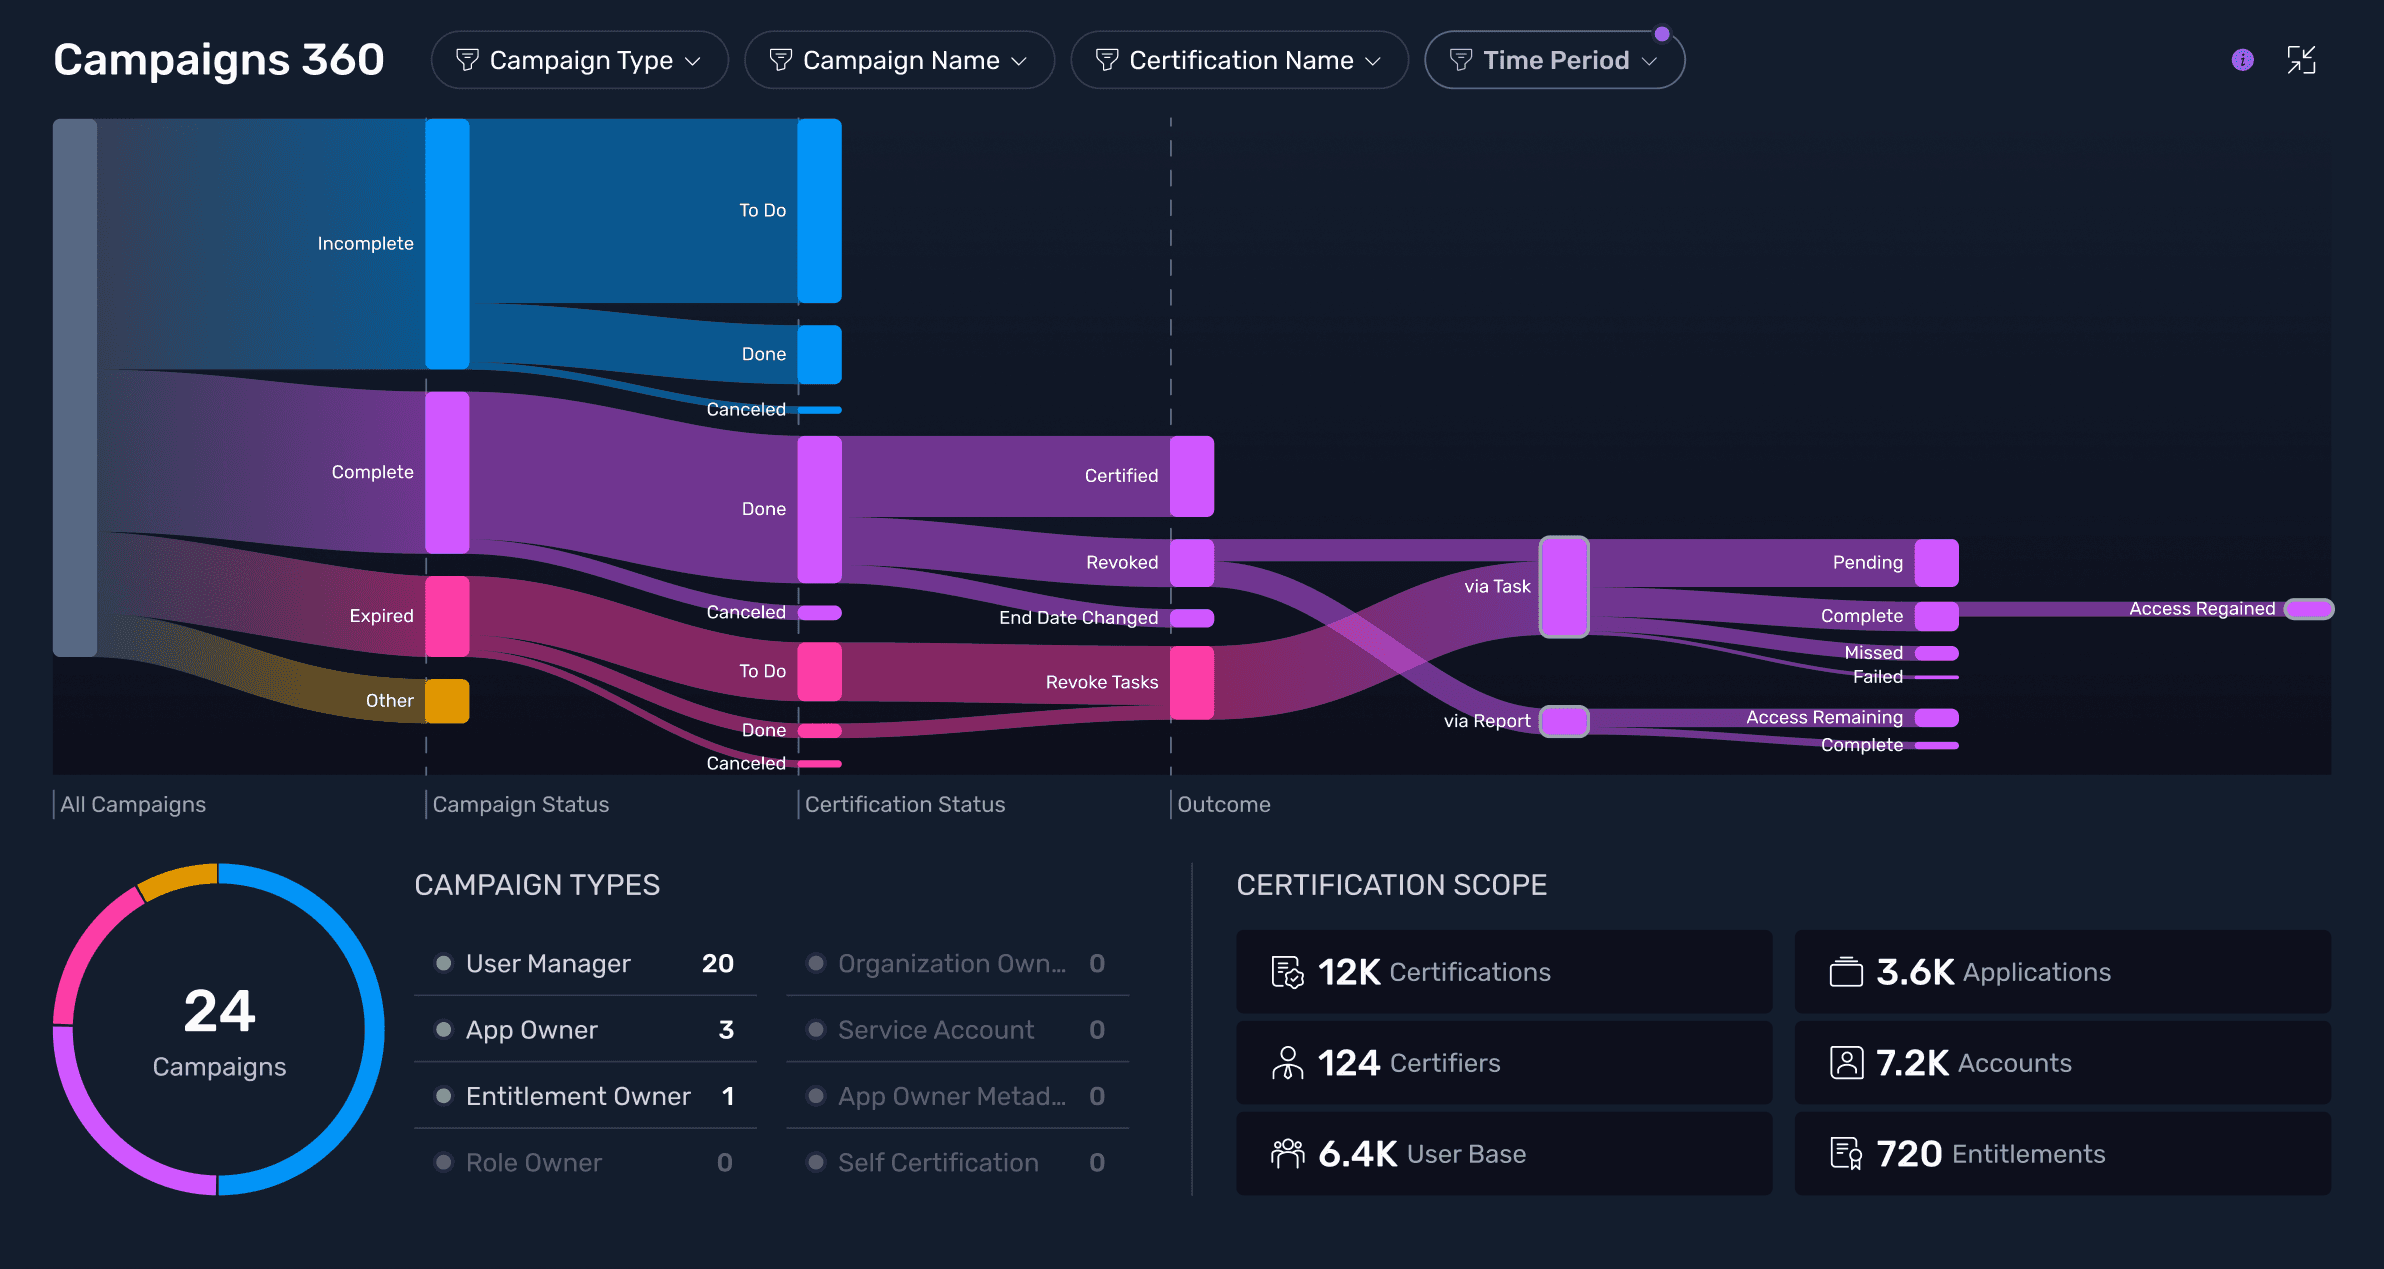
I delivered a centralized identity security dashboard giving enterprise customers real-time visibility across identities, accounts, roles, entitlements, and cloud resources in a single, actionable view. The out-of-the-box experience established a scalable OOTB foundation with drill-down interactions which let customers move from high-level risk signals to granular data without leaving context.
The architecture was designed from day one to support AI-powered customization in subsequent releases. Beyond the fixed dashboard, customers could generate custom charts directly from their connected data using a SaviAI-powered workflow, then add them as dashboard widgets. It was an early proof of the AI framework in a high-stakes, data-rich context.
Outcomes
The dashboard shipped on schedule and was live with 12 enterprise customers by end of FY 2025 including GE Healthcare and Accenture. Customer feedback validated the core information architecture, with drill-down behavior landing well, and directly informed the next development phase, with deeper action workflows already in the pipeline. 16 stakeholders aligned across product, engineering, and customer success throughout delivery.